
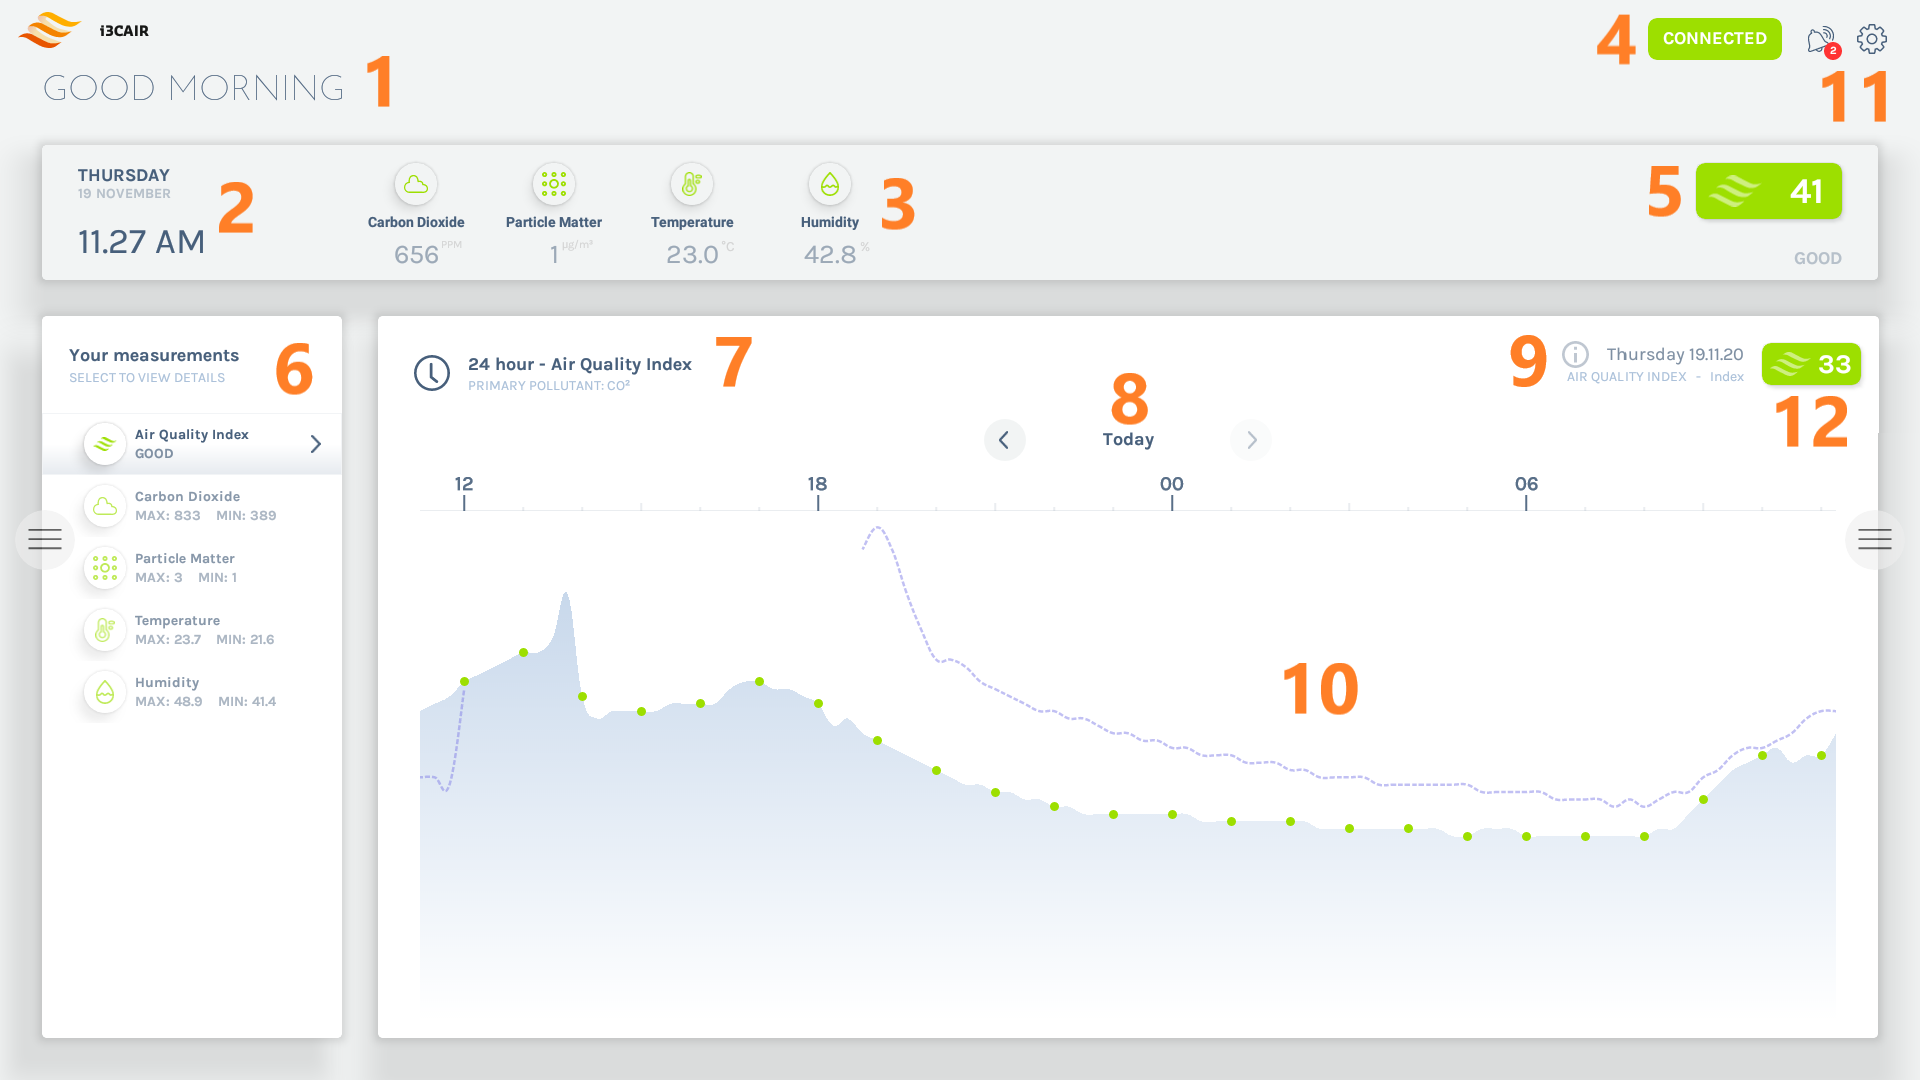
Explaining the interface
-
A message welcoming you appropriately according to the time of day
-
Current date and time
-
Current sensor data for every sensor type - refreshes every 5 seconds
-
Connection status (green is connected, grey means not connected)
-
Current air quality index - refreshes every 5 seconds
-
The i3CAIR app stores sensor data for 7 days. Via this menu (the horizontal tabs), one can consult the 7-day rolling data of the air quality index or the data from each individual sensor.
Clicking on a tab will display the graph of the past 24 hours -
Time range, along with the type of sensor that was chosen
-
Day of the week when the measurements were stored - clicking on the arrows will move to the past/next 24 hours
-
The currently selected day and selected sensor type with its measurement unit
-
Graph - refreshes every 15 minutes - touching the graph will provide you detailed information of the data measured at that point in time. The dotted line shows the data exactly 24 hours prior to that point for comparison
-
The alerts and settings buttons. The alerts button shows how many unread alerts are available. Tapping the alerts button will open a side panel with alerts and additional information. Tapping the settings button will open the settings panel
-
The average value for the selected day and selected sensor type - refreshes every 15 minutes